
“The Colder Side of Global Warming©”
Frequently Asked Questions [FAQ] Page
As more questions are added, this page eventually will be indexed, but as there are only a few entries now, just scroll through the list and see the most frequent requests.
1. In the late Michael Crichton’s book “State of Fear” is he right in claiming that Global Warming is just the effect of our measuring temperature in urban areas, and as they expand over time, their “heat island” effect naturally results in historical temperature increases?
-
Both Global Warming and the acceleration of Global Warming due to human activity are real, the latest rise beginning about 18,000 years ago, and the acceleration within the past 200 years. The misinterpretation in “State of Fear” becomes obvious when you see how temperature rise has been measured in all the world’s oceans as shown in the slides of my “Colderside©” presentation, and the oceans are not plagued by urban heat islands.
-
Now I’m by no means entirely “down” on Crichton’s book. On the contrary:
-
1. The epilog on Eugenics should be required reading by anyone with an interest in good science. Michael Crichton generously made it available on the internet at: http://is.gd/yhUmDP
2. With some unfortunate irony, he missed the connection between the end of Lysenko’s reign and the brilliant Russian VOSTOK research that was spurred on by the East trying to catch up to Western Mendelian genetics as it was covered in the “Colderside©” presentation.
2a. “Explain please why sea level rise won’t be accelerating”
-
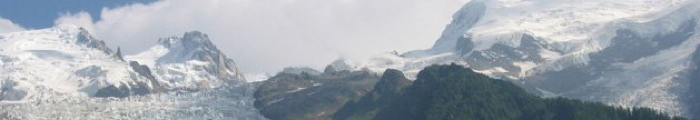
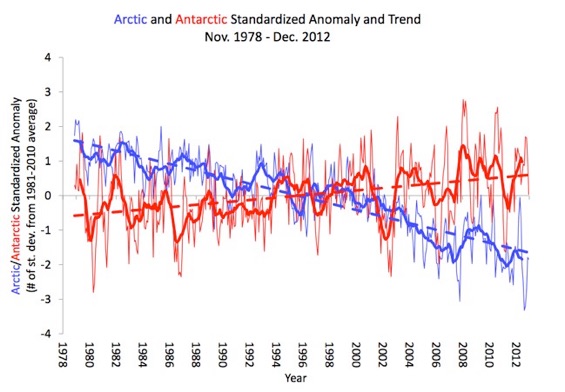
As the Earth and its oceans continue warming, we’ll likely get about an additional four inches or so of sea level rise due to ocean thermal expansion, and at most another 3 inches from edge ablation of Greenland's and Antarctica's glaciers but no more! The North Polar Cap is melting, some years more than others, and with surprising rapidity, as you can see in some of the videoclips shown in the formal presentation. But for the most part, it is floating and has already displaced the water within which it floats. This is Archimedes’ Principle, and he figured it out over 2,000 years ago – thus there’s no sea level rise from the Arctic floating polar ice melt. On the other hand, Antarctic ice, particularly the floating ice “doughnut” surrounding the continent, has been breaking area covered records for the past 5 years. Both are juxtaposed in the graphic below:
-
-
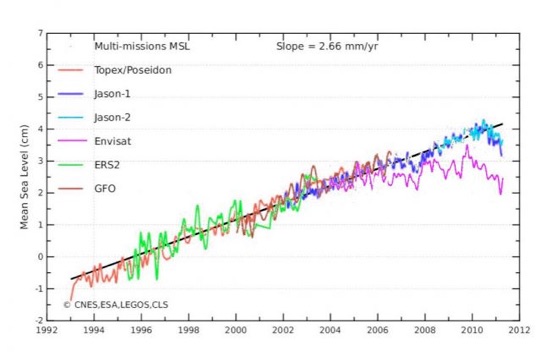
2b. Sea-Levels have basically flatlined since 2005. The old trendline was left in for comparison purposes. Now the University of Colorado has added a Glacial isostatic “correction” (GIA) that relates to ocean basin volume, but real sea-levels measured by tide gauges around the world need no such adjustment to accurately measure their height. The videoclip at the top of this FAQ page gives additional insight.
Another worthwhile look at things is afforded by the graphic below which compares satellite measures of Sea-Level from some sources that DO NOT add the GIA, such as ENVISAT, recently taken out of service. As you can see, recent Sea-Levels are not rising at any accelerated pace, by any measure, and removing the non-height related “adjustments” actually has some dropping. Between 2005 and 2014, Sea-Level in the Gulf of Maine actually fell by 3mm!
A useful compendium of Sea-Level information and links can be found at: http://www.sealevel.info/
2c. “But what about Greenland, Iceland, and Antarctica melting?"
-
Now the ice on Greenland and Antarctica isn’t floating, and if melted would certainly contribute to sea level rising, but the Russian Vostok and European EPICA ice core history covers many periods, each time when it was even warmer than now, and when the north polar sea opened up (as it is doing now per Ewing’s and Donn’s prescient insight), at each of those times, the world moved into an “Ocean Effect” fueled albedo change and subsequent Ice Age. Those Ice Core records couldn’t exit if Antarctica, Iceland, and Greenland had ever melted!!!, and as any acceleration of Global Warming counter intuitively short circuits the present warming cycle, it will get colder sooner rather than later, with no appreciable additional Greenland/Iceland/Antarctic ice melt.
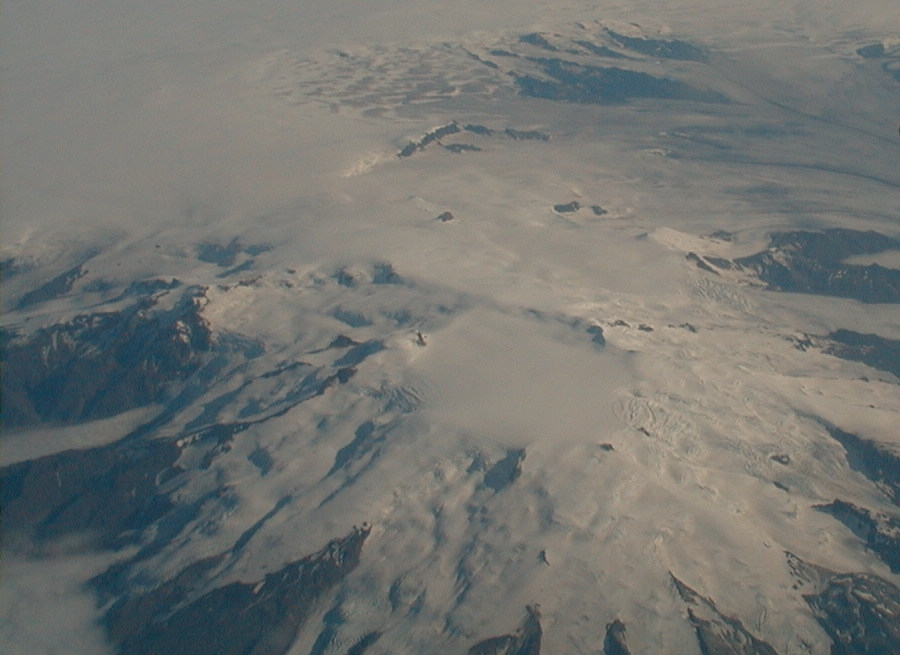
Icelandic Volcano Eyjafjallajökull
3. “What are other (near term) implications from your theory?"
-
First, although I endorse the theory, it is Ewing’s and Donn’s theory, and it is their insight that deserves the credit.
-
Second, as more Arctic Ocean becomes exposed for longer times before being sealed by seasonal pack ice formation, snows will fall earlier each year, in larger amounts, and linger on the ground longer into the spring. Albedo reflectivity from snow is negligible during the dark arctic winter, but both in early fall, and as spring arrives, the snow in higher latitudes remains on the ground longer, and reflectivity increases. Under these conditions, the central US and the East Coast will experience cooler springs and the transition into summer temperatures, although somewhat later, will be relatively rapid. The US West Coast will have warmer springs and summers, as will Western Europe. Warmer weather may may not make it through October’s end almost everywhere, and winters will be sharply colder. The massive pack-ice loss of 2007 followed by a similar loss in 2012 set up ocean effect snows on the Arctic Shores that increased reflectivity. Colder Northern Hemisphere winters with sharp temperature contrasts were the inevitable result. Europe's 2010-2011 winter was a consequence and in the US we saw 49 states with some (high albedo) snow on the ground during January 2011. The September 2011 Arctic Ice cover was almost parallel to the 2007 record open Arctic!!! However, a strong “La Niña” stratified weather and temperature over the Northern Hemisphere in 2011 and 2012. I covered it in http://archive.wbai.org/files/mp3/wbai_111213_200100ecologic.mp3, a NYC environmentally oriented radio show (on 12/13/2011) where I made my “Annual” climate forecast.
4. “Are “Mainstream Scientists” and “Global Warming disbelievers” both wrong? How do you reconcile your presentation to the current media’s portrayal of Global Warming? "
-
On the contrary, to a very large extent, they’re both right! And neither seems to give much quarter to the other!
-
The majority of “Mainstream Scientists” as exemplified by the IPCC, very correctly and accurately have looked back upon the past 200 years and ascribed some of the observed Global Warming acceleration to human factors. The few who blame all of the warming on people are simply wrong. The “disbelievers” point to Ice Core data clearly showing a cyclical pattern, and declare that within the range of the cycle, everything’s “normal” and we shouldn’t be too surprised if solar variation, precession of the equinoxes, Milankovitch Cycles (see FAQ 16 below), etc., cause climate variation, and that human activity plays a small part, if any.
-
There are many examples of well meant ‘explanations.’ In the short time available in the 2+ hour presentation, I mentioned Michael Crichton’s “Urban Heat Island” disclaimer (see FAQ #1 above), followed by the ocean temperature and NYC Watershed slides that pull the rug out from under most (but not all) of it. The “disbelievers” still don’t have a cogent explanation for the 140,000 year ± cyclical phenomenon as accurately portrayed by Ewing and Donn – independent of human activity over the eons, but based upon glaciations fed by an open Arctic, whose re-opening has been clearly and rapidly accelerated this time around, and likely augmented by our species too.
-
5. “How about “Carbon Management.” Is that a solution we can live and work with?
-
Yes and No, and it depends upon which problem(s) you are addressing. The reasons most offered that purport to curtail or eliminate climate change or Global Warming are the wrong ones, and “No” is the answer here. No amount of “Carbon Management” and associated “Green” efforts will stop the Arctic multi-year ice from melting within the next 20 or so years. It was already too late when the industrial revolution began!
-
If tomorrow, every factory would shut down, every automobile and plane would cease operating, etc., etc., the Arctic Polar Cap would still continue melting, period!!! The associated global albedo (reflectivity) and climate changes are already beginning to happen! And NO cessation of human carbon oriented activity will have the desired impact. There are other ways to address that problem, and the Norway/Bear Island/Svalbard solution discussed in detail in some of my “Colderside©” presentations actually can add controls to the problem. In addition, the beneficial solution to the world’s growing fresh water problem can be addressed by the same mechanism and is likely the most cost effective response with available technology.
-
The “Yes” part of the answer on paying attention to “Green” issues is still absolutely valid, for energy usage, Hubbert Curve, conservation, environmental, and quality of life issues that include air and ocean pollution from real pollutants, poisons (CO2 is not among them), and carcinogens. For these reasons, green management, recycling, conservation, etc., makes unequivocal sense, and hope you behave accordingly! But inclusion of “Global Warming” in the mix (as the presentation explains) may just make it easier for the general public to “buy into” these suggestions, but unfortunately it will have incredibly little impact on the climate. For more information, see:
-
-
6. You mentioned moisture transition was analogous to how Dentists work. You’ve got to be kidding???
-
Here’s how Dentistry figured in the discussion:
-
Recall that temperature of water (ice, liquid, and vapor) is a direct function of molecular motion, and as we transition from one cooler state to another warmer one, molecular motion must increase.
-
On a stove, we can melt ice and then boil off the subsequent water to create water vapor, adding heat energy throughout the process. By the time we create the water vapor, these H2O molecules are really moving, having absorbed the energy that got them to that state.
-
Ocean temperature also factors into the likelihood that a molecule near the surface will convert into water vapor, but wind is most often the deciding factor that provides the final “kick’ of kinetic energy to create water vapor. The ocean “chop” in the slide of the Divi-Divi tree illustrated the effect of the Trade Winds – the constant 18 or so mph that constantly liberates water vapor from the warmest oceans in the world.
-
Hurricanes liberate MUCH more water vapor, by supplying incredible amounts of kinetic energy to the roiling oceans underneath the storms, with violent wind force that batters and tears at the water, liberating prodigious amounts of water vapor in the process. It is this water vapor, loaded with latent energy, that fuels the energy needs of a hurricane.
-
Here’s where the Science of Dentistry figures in: Most people believe it is heat (from the sun, a stove, fire, etc.) that supplies the energy to create water vapor. This is abetted by the term “Latent Heat of Condensation” to describe the release of energy when water droplets condense out of cooled water vapor. If Meteorologists would have had the sense to call it “Latent Energy of Condensation” some of the confusion might be avoided, for it is usually wind that originally supplied the final energy “kick” into water vapor.
-
When Dentists want to dry out a just rinsed out tooth cavity, they don’t apply a heat lamp. Instead they direct a stream of air (i.e. wind) over the area to immediately dry out the tooth. The air stream adds kinetic energy to the water present and immediately kicks the water into a higher energy state – water vapor – that instantly dries out the tooth surface. The area now feels a bit cold, because in becoming water vapor, lots of energy has been absorbed by the now energized water vapor molecules, and some of that came from the tooth (and surrounding gum), extracted by the transitioning water vapor.
-
This was included in the description of the effect that wind has in liberating water vapor, first from the Great Lakes and a later ice-free Arctic Polar Sea and subsequent condensation into snow. Here again, it is the equivalent of a Dentist’s “wind” that serves to convert the liquid water into vapor.
7. Why haven’t I heard about Ewing and Donn before?
-
Now you have! Decent biographical information is found in many places on the internet. I believe that the Navy still gives its “Ewing Medal” for achievements in oceanographic excellence. You can see slides and hear detailed information in the presentation about some of the “discrediting” that later was stunningly shown to be incorrect.
8. Are you ever going to post your presentation on the internet?
-
This presents a problem that may be solved in the next few years., as recordings have been made by some Universities and Government institutions. When I get comfortable with one of the recordings, I'll seek the ability to either link to them or post them here. Some of my slides and videoclips, like the Jupiter clips, are incredibly dense and consist of thousands of pictures which you view in a few seconds. Download times at appropriate resolution would just be too long. However, there are videoclips of my talks at conferences that you can link to in the “Video” & “Media” sections of these wepages.
-
However, the Town of Hampton New Hampshire’s Energy Committee had posted a 1.5 hour video recording of a “Conversation” with me on September 3, 2009. Sea-Level changes were mentioned but without the equations and detail in these FAQ pages. The following links used to function, and may again do so, but as of January 2015 are not functioning:
-
http://hamptonchannel22.pegcentral.com/player.php?video=2da5a0216f51be2b0f16ad0f39573a52
A more recent Hampton presentation (2011) that focussed on Sea-Level rise can be linked to here: http://hamptonchannel22.pegcentral.com/player.php?video=f028328494185e20c46d25dc6d37c91e -
9. How about audio clips?
-
A number of radio interviews are archived on the internet. You can access the October 5, 2004 WBAI Radio (NYC) program here (MP3, WMA). The hour is called Eco-Logic and is hosted by Ken Gale, an accomplished environmental interviewer. Recent Climatological events have actually accelerated the trends discussed. Now (as of 2015) there are 5 such audioclips - each one very accurate and on the Media page.
10. Can you briefly summarize the content of your presentation?
-
Sometimes third parties can actually do it better! The American Institute for Aeronautics and Astronautics’ Houston Chapter put out a special 50th anniversary of NASA issue in late 2008, and their technically astute Assistant Editor, Sean Keefe, put together a summary of my visit to NASA’s JSC. A PDF of the issue can be downloaded here:
-
In addition to the Colderside© summary on pages 5 & 6, the issue has other fascinating articles, including an interview with Norm Chaffee, the NASA scientist who helped orchestrate the “barbecue process” that saved Apollo 13.
-
In the meantime, I try to schedule presentations on a regional basis, so as to keep travel and other costs reasonable. E-mail me at < tom@colderside.com > to see if your university, group, company, organization, etc., can be accommodated soon, and please be sure to read the MFN stipulations!
“The Colder Side of Global Warming©”
FAQs on Sea-Level and “Leap Second” Pages
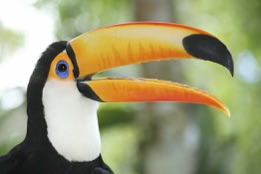
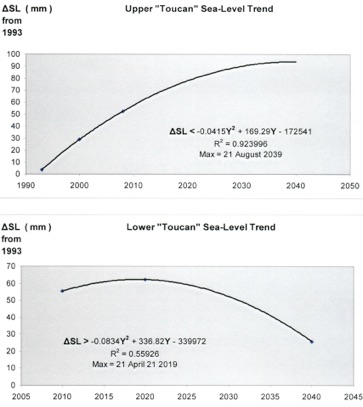
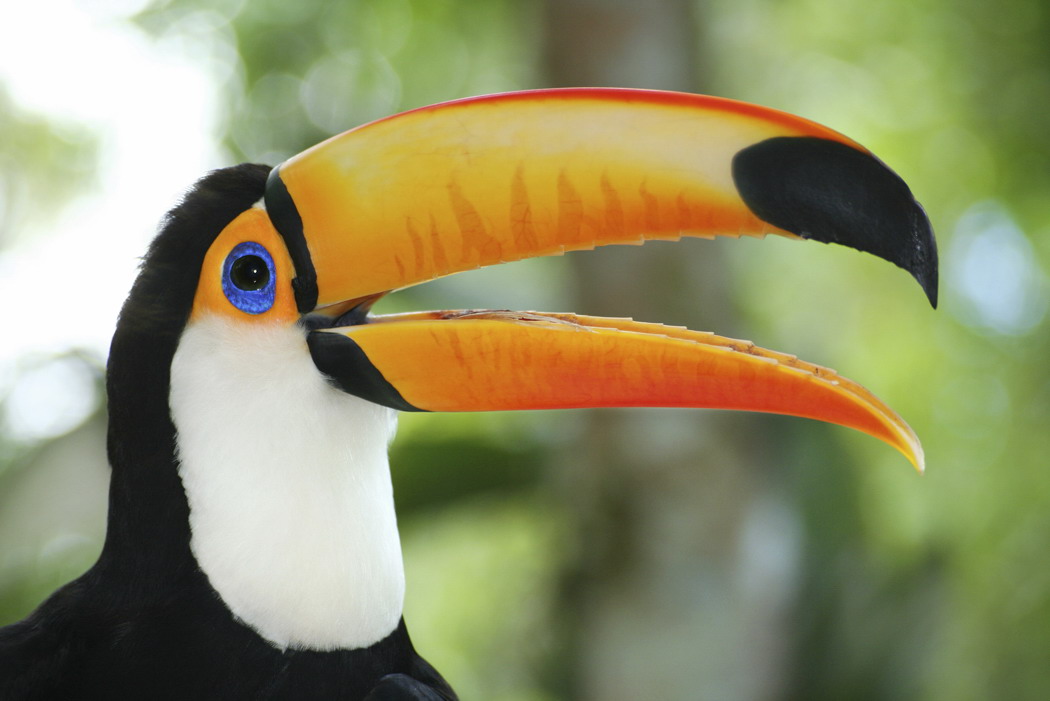
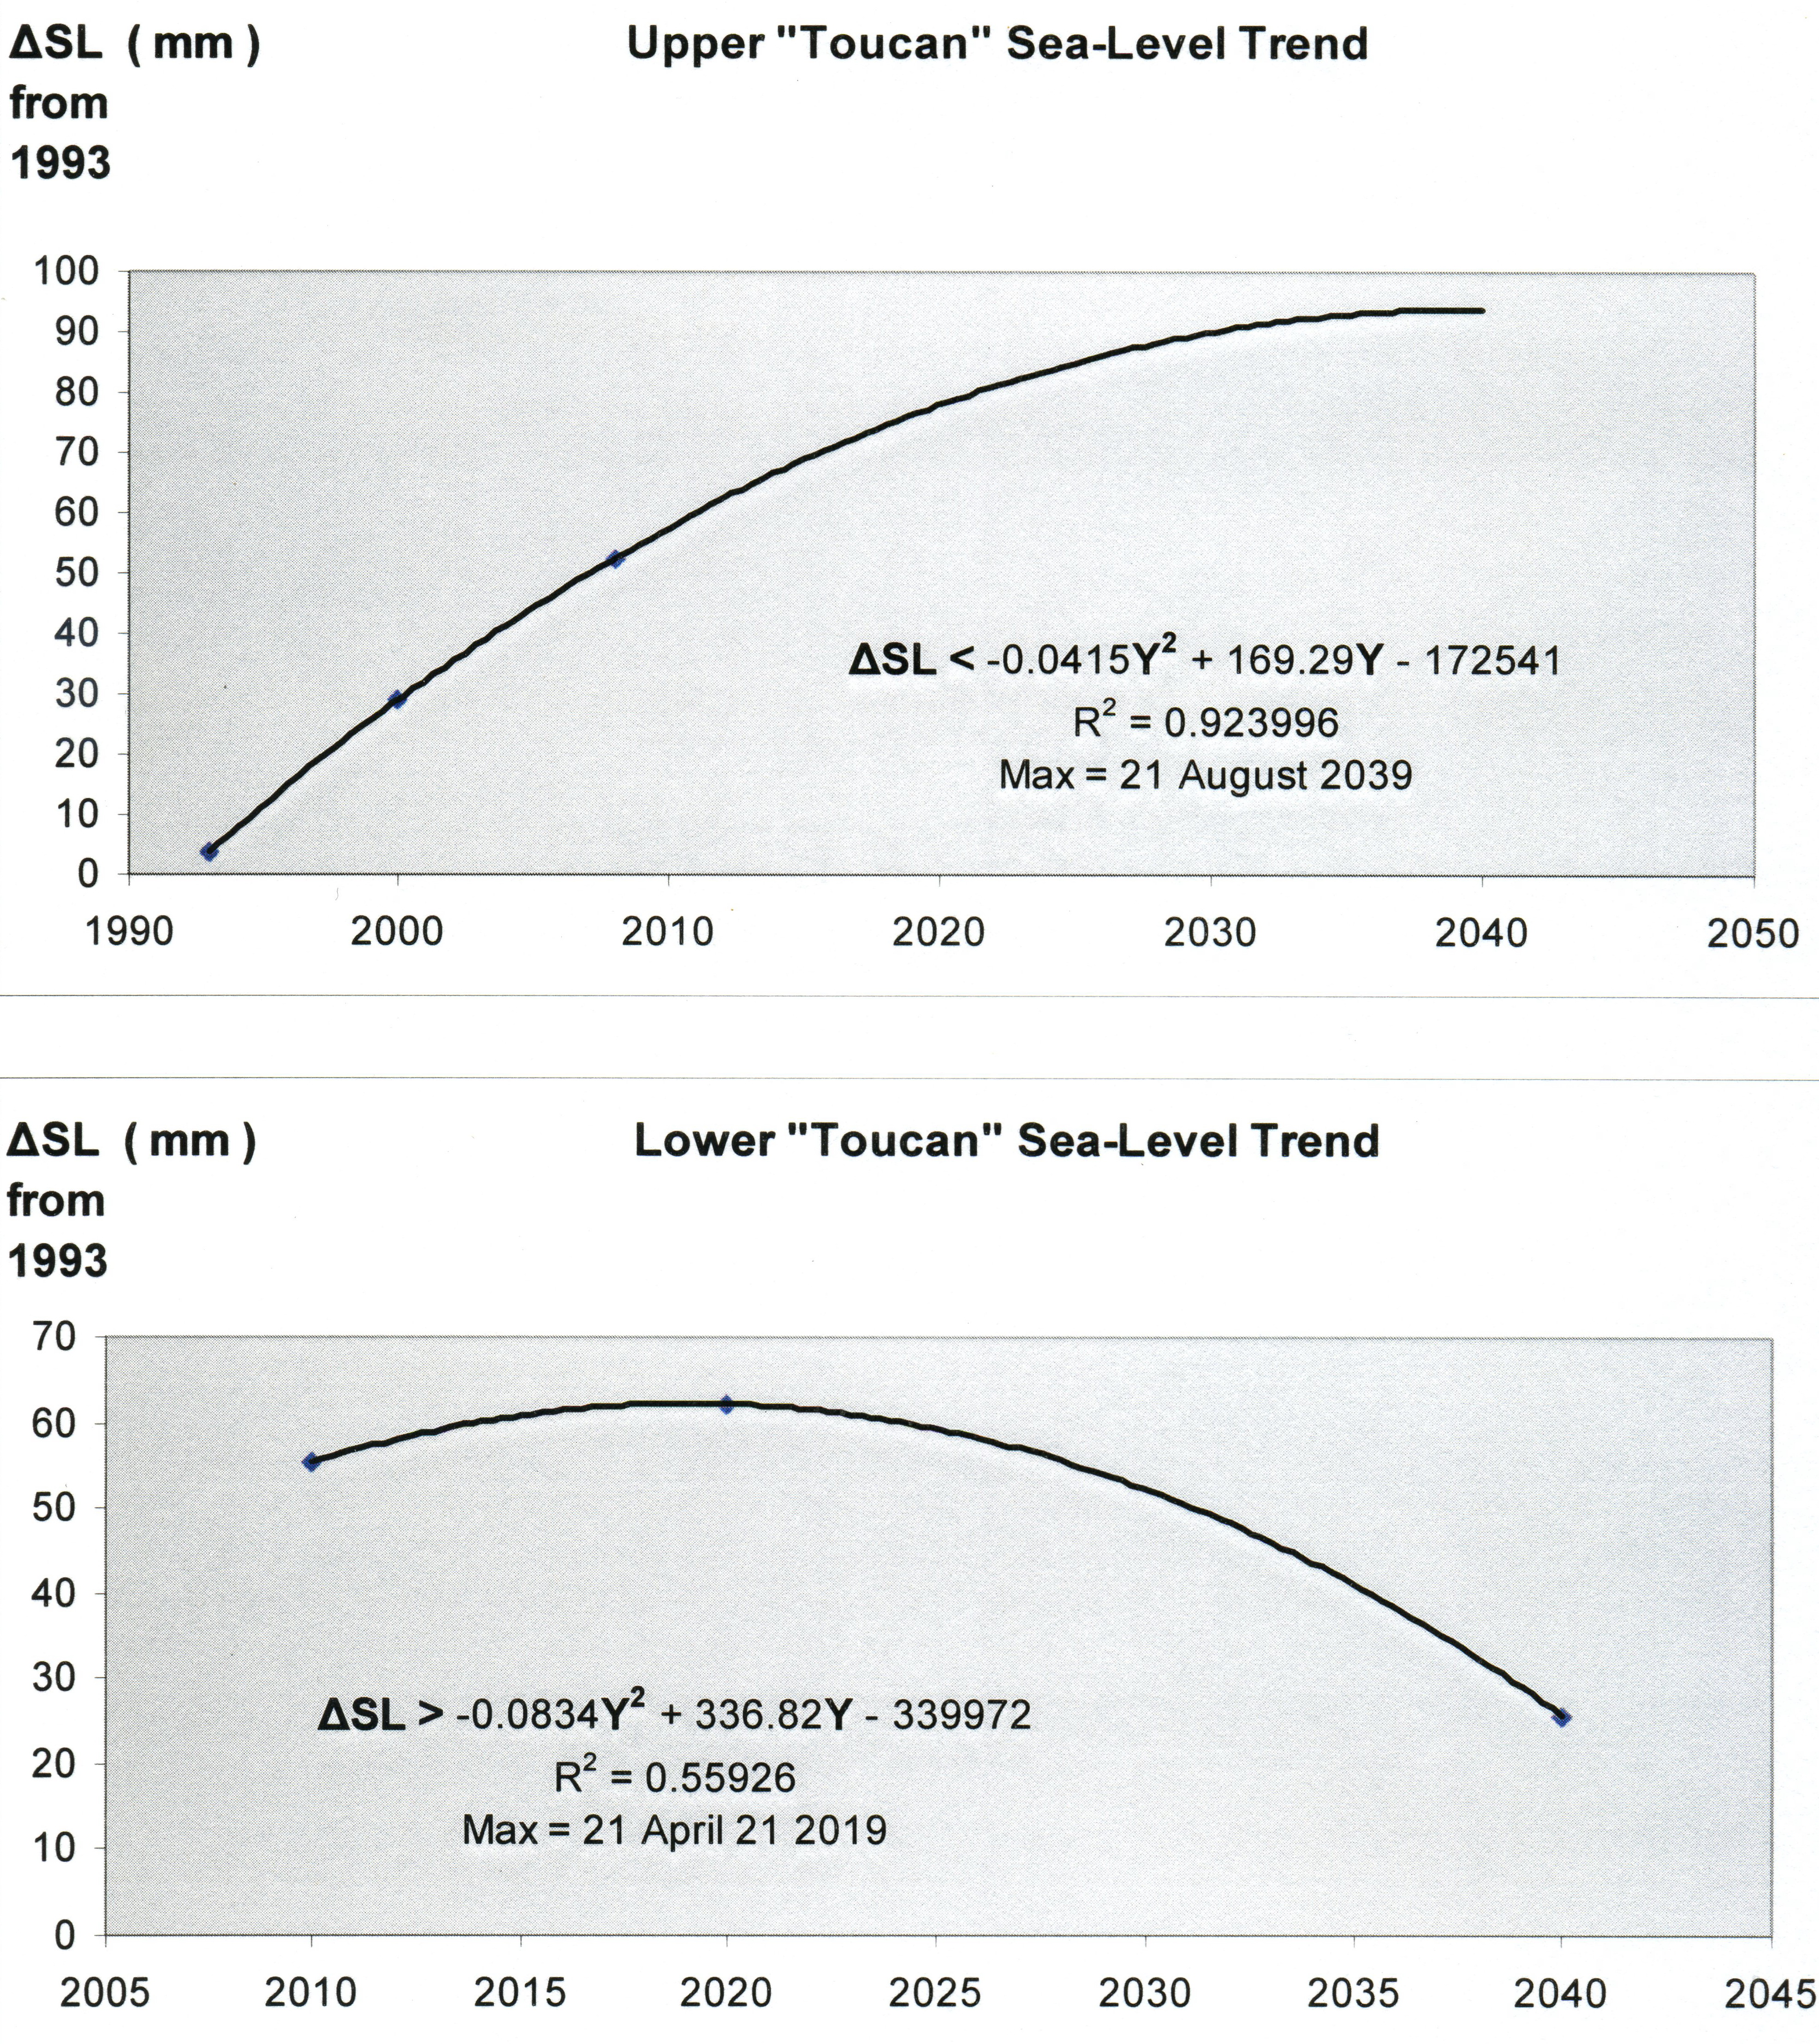
11. Can you briefly discuss the “Toucan Sea-Level equations©” described in your presentation?
-
The “Toucan Sea-Level equations©” referred to the shape of two inequalities zeroing in on the upper and lower Sea-Level limits expected in the near future. When viewed together, they roughly took the shape of a Toucan’s beak, and as more data becomes available, that “beak” will begin to slightly change shape and close.
-
-
-
The equations are in an inequality >, <, (Greater Than, Lesser Than) form, and like the bird’s beak, have thickness to accommodate the variation found in the Sea-Level data upon which they are based. The data set used did not have modifications, so that no seasonal adjustments, inverse barometric adjustments, or GIA was applied. Variation in any given year has stayed within a 20 mm band and the equation’s intercepts have that adjustment added in, on the upper and lower bounds, so that there is virtually NO CHANCE that Sea-Levels will rise above, or fall below their limits. In the event that external earth based natural factors intervene, the lead times for making changes will be very substantial in any case.
-
-
If you want to see some satellite graphics and use different data sets, go to the University of Colorado web site http://sealevel.colorado.edu/results.php which has seasonally-(un)adjusted, and inverse-barometer-(un)corrected TOPEX/Jason data. Their most recent chart is linked to in FAQ 2 above, with the disclaimer. The addition of the Glacial Isostatic adjustment (GIA) has biased the result to recording ocean volume changes and actual sea level has been augmented beyond its real value by the GIA. FAQ 2 above also has the ENVISAT graphic without the GIA bias added.
12. I constantly hear about massive coastal flooding and that whole seacoasts will be inundated by rising oceans. Your “Colderside©” presentations imply that it won’t happen.
-
There’s more involved here than just the Tide Gauge and Satellite data, and I’ll address another aspect in the next “Leap Second” FAQ. Realize that in the last century, the oceans have risen less than 190 millimeters – that is 7.5 inches! Two of the components, increased land-based snow accumulation, and decreasing thermal expansion (as albedo increase begins to cool parts of the ocean), are already helping to ameliorate the rise. Recent warming of the Arctic ocean has caused pack ice to shrink and expose shorelines to more open water. Thus "Ocean Effect" snows can deposit more snow on interior Greenland and Antarctica’s “Ice Doughnut” also accumulates additional snow, and that is exactly what's being observed. Even though the edges of Greenland and parts of Antarctica are losing ice at markedly accelerated rates, their interiors are outpacing that loss and increasing their rate of accreting snow and ice. When that gain overtakes the edge melt, this particular component of sea level rise turns negative. As some of these effects counterbalance others, expect them to vary each year (and they do!).
-
Now there are parts of the world where coastal areas are sinking on their own. Venice, Italy, comes to mind, and the US Texas Seacoast too, as the water requirements of their large cities work to deplete the coastal Chicot, Evangeline, Jasper, and Catahoula Aquifer layers, leading to some land subsidence and seawater intrusion into the underground water supply. In West Texas, the Ogallala Aquifer’s depletion rate exceeded current replenishment, but heavy rains in the first half of 2015 may help. In Texas, some first-rate minds are focused on the problem, including Professor John W. Nielsen-Gammon, the Texas State Climatologist who has been keeping the IPCC honest (as much as he can) with his careful error checking ability intact.
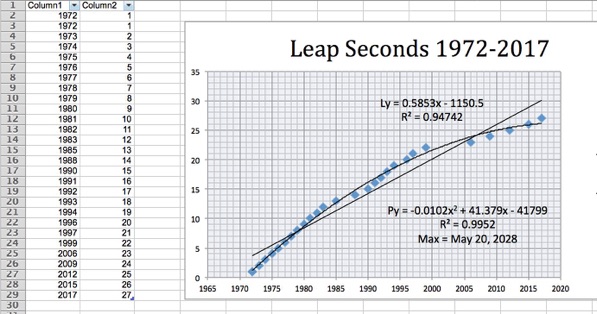
13. You mentioned a decline of trend in additional “Leap Seconds” as being part of the evidence for Sea-Level rise deceleration and eventual decrease.
-
Leap Seconds are added to our year to accommodate the gradual slowing of the Earth’s rotation due to many factors such as energy loss through oceanic and atmospheric tidal friction, lunar gravitational “drag” on the planet, surface mass redistribution "rebounding" from glacial weight, and interior magma and core friction, to name just a few. But a Polynomial Curve fit that is more highly correlated than a linear fit, shows the rate of leap second addition to be decreasing. 2012 saw one more added as did 2015, and 2017 gets another on January 1st. The Polynomial curve below still fits with unusual precision.
-
-
-
-
Now, as mentioned above, many factors are involved here, and the trend actually began decreasing in the late 1980s, but resumed in the early 1990s (a good case for Mt. Pinatubo’s influence can be made here), only to decline again in recent years. The increased snow deposition on land surrounding the Earth’s axis of rotation is the major suspect. The videoclip at the top left of the colderside home page describes whats happening in Antarctica, but effects occur in the North too!
-
As an open Arctic Ocean (40% open in 3 of the last 5 years) adds more available moisture to fall as early snow in northern latitudes, the effect is that of adding momentum to the planet’s rotation, much like an Ice Skater pulling in arms close to the rotational axis of the body to increase spinning speed. Now the snowmelt of spring returns the deposited snowmass to the oceans or atmosphere, but earlier snowfall and later/slower melting, both serve to gently add that momentum to the Earth’s spin. So the slowing (and need to add “Leap Seconds”) diminishes, and eventually will be replaced by subtracting them, as more and more Arctic ocean opens up and massive snow accumulation coupled with albedo change and colder temperatures begin to accelerate the Earth's rotation.
-
The equation will be revised again, if additional leap seconds are added “off” the polynomial curve, but as of January 2017, that has not happened & the two most recent are ‘spot on.” This result substantially confirms the accuracy of the 2009 2nd degree equation shown in the graphic above. There is a chance that one, or at most three more leap seconds will be added before the equation levels out and begins falling (thus resulting in subtraction of leap seconds).
-
I’ll update the above chart too if/as “Leap Seconds” are added. With (lots of) luck, I’ll be alive in years after 2028 to witness the first “Leap Second” subtraction!
14. Couldn’t El-Niño be responsible for augmenting Earth’s rotational speed? The warming equatorial ocean’s thermal expansion (or contraction in the case of La-Niña) would have affected the planet’s momentum, right?
-
Not quite! Thermal expansions and contractions are (very) gradual processes taking months to change. By increasing or decreasing the sea-level through temperature change, the oceans have much time to adjust through current flow, and that is exactly what happens, as the water will seek its own global level. Evidence of this self-adjusting is that we see no “Niño/ Niña” evidence visible in the Tide Gauge sea-level data, which extends back to the 1800s. You would expect a signal to show up in the form of a wave flowing through the data set, as there have been nine such oscillations in the period, but only one trend change, synchronous to the recent increased land based Arctic and Antarctic snow deposition. The snow/ice remaining on land actually shifts equally distributed water mass to the Earth's axis of rotation.
15. Milankovitch Cycles have been credited as being predictors of climate. Any validity to the Ewing-Donn “Open Arctic” model being predicted by Milankovitch?
-
Milankovitch Cycles include a combination of Precession (26K years), Eccentricity (95K years, and Obliquity (42K years). The theory holds that when in phase, Glacial and Interglacial periods occur. However the Vostok and EPICA Ice core records may well understate the length of these intervals, yet even if exact, Milankovitch Cycles have predicted nine of the last four well defined cooling and warm periods. Coincidence is not necessarily causation, and when 5 “predicted” periods just aren’t there, Milankovitch falls a bit short. Ewing-Donn, on the other hand, describe a precise physical mechanism [ Open Arctic, Sea level drop, Closed Arctic, Sea Level rise, Open Arctic (ad infinitum) ] that clearly explains all of the intervals. Now Sun Spot linked solar variability (not contained in Milankovitch) is also evident in the Beryllium 9/10 ratios noted in Ice Cores covering the Maunder minimum, but cover much shorter time periods. The Sun Spot signal, though weak, is evident in troposphere temperature measurements, but does not show up in Tide Gauge, JASON/TOPEX, or ENVISAT Sea Level data.
-
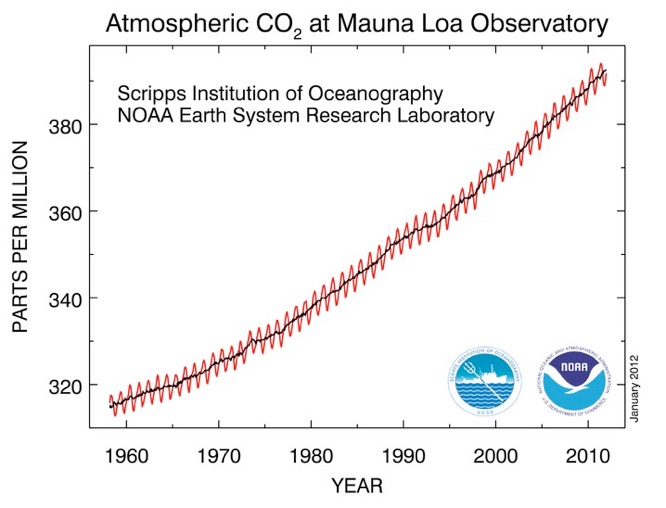
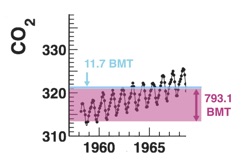
16. How about CO2 influence? Isn’t it still rising?
The Scripps Mauna Loa “Keeling Curve” shows monthly CO2 averages, but notice the flat areas 1963-1965 and 1991-1993. These are almost flatline CO2 readings certainly not due to industrial slowdowns or automobile emissions reductions, but to volcanic eruptions from Agung in Indonesia and Pinatubo in the Philippines respectively. Attenuation of sunlight and ocean cooling combined to reduce Oceanic release of dissolved CO2. Once the stratospheric ash fell back to Earth, atmospheric CO2 continued on its upward trend, as the oceans continued warming and full strength sunlight abetted more dissolved CO2 release. No Human directed “management” of CO2 auto or industrial emission could hope to achieve these results, and since CO2, a lagging indicator, doesn’t drive temperature, attempting to do so is futile. The recent “CO2 Disconnect” at the bottom of FAQ 6 shows the extent of its influence.
17. What are the effects of Volcanic outgassing? I heard that an Australian Professor, Dr. Ian Plimer, said it was enormously significant.
Professor Plimer had made many wise statements in his illustrious career, but this was not one that he ever made, or should be attributed to him.
1: It is quite true that volcanoes emit prodigious amounts of CO2 and other GHGs into the atmosphere; over the eons exceeding what CO2 humans have recently added; BUT see #3 - 6 below!
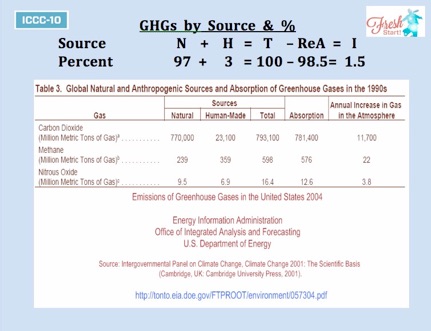
2: Humans actually add relatively little CO2 into the atmosphere - 2.9% annually can be traced to them, and the oceans and biosphere (re) absorb half of that, leaving about 1.5% as the net annual contribution by people.
3: Volcanic eruptions result in atmospheric CO2 reduction, even while they emit CO2. They do this mainly by attenuating annual oceanic outgassing, and to a lesser extent, by impairing plant activity.
4: In a year without major eruptions, warming oceans "kick out" heavier CO2 molecules as molecular motion within seawater increases. Every ocean (except for the decreasing temperatures in the Southern Ocean) has been experiencing slightly reduced temperature increases, but increases nonetheless, and thus, contributing to CO2 outgassing.
5: Oceanic dissolved CO2 is emitted through other processes too, all of which are attenuated by presence of atmospheric volcanic particulate matter.
a: Volcanic particles impair sunlight, preventing some oceanic warming and consequent CO2 addition to the atmosphere.
b: The same particles serve as nuclei for water vapor condensation, forming more clouds than "normal;" the additional cloud cover also ameliorating oceanic warming and CO2 release.
c: The resulting cloud albedo increase, and particulate matter in the atmosphere, combine to interfere with photonic interaction with molecules on the ocean's surface that also play a part in CO2 release.
d: Thermo-Haline circulation is affected, particularly vertical currents that transport denser water to the surface that also involves CO2 release.
e: Sunlight attenuation also negatively affects algae and other oceanic plant growth with attendant CO2 effects.
f: Additional storm cloud formation transfers ocean heat to the clouds and atmosphere, cooling the ocean surface and impairing CO2 release
6: There would be sharp upward spikes in the Mauna Loa CO2 record if #1 above was the only effect of eruptions - the truth is otherwise. Perhaps the best example is Agung, which erupted for two years (1963-4), off and on.
Here's what it did to the Mauna Loa record:
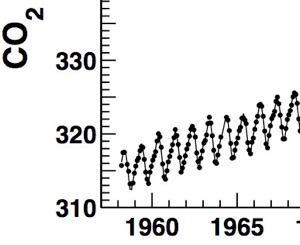
A tiny upward “blip” of CO2 increase heralds the eruption’s 1963 start, but after, notice the actual reduction in springtime peaks for the next three year period, totally overcoming any addition of CO2 that the volcano itself added during its continued activity. When the "dust" settled out of the atmosphere and Agung related sunlight impairment was no longer a factor, CO2 continued its upward path. Mount Pinatubo had a similar effect in 1991 - 1993, clearly reducing the springtime CO2 growth rate, though not negatively as Agung did.
7: The December 1992 lunar eclipse was the darkest on record, because of the suspended volcanic ash sourced from M. Pinatubo. The usual red sunsets and sunrises were absent for almost 3 years, as the atmospheric dust prevented refraction of longer wavelengths through the atmosphere.
8: The Icelandic volcano Eyjafjallajökull and Mt. St. Helens were much smaller than either Agung or Pinatubo (about 100 times smaller) - both contributed CO2 to the atmosphere but their ash effects impaired oceanic release for a net result that was inconsequential and not visible at all in the Mauna Loa record.
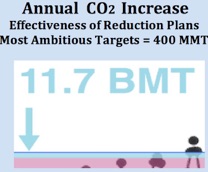
9: Comments elsewhere attributed to, but likely not made by Dr. Plimer about the minimal impact of CO2 reduction efforts, do have validity only because they are a subset of an already small human contribution. The following graphic are the source for # 2 above, and the slight decrease in CO2 additions by human curtailment efforts in any given year are not even measurable in the greater scheme of things, or by any instrumentation that we have available.
The magenta shaded area indicates the increase between 1962 and 1963, and the blue shading the increase in that period. The darker blue line is far thicker than what 400 Million Metric Tonnes would represent - basically invisible in the graphic, and in the CO2 record.
18: Why don’t you post your speaking engagements on your website?
-
Most of my speaking engagements are not usually open to the general public. They may be clients who want a talk specifically structured to their group or audience, colleges or universities and schools that do not want the general public to access their buildings, or just groups that have an educational desire for themselves. Security issues are also of concern at government facilities where I have given talks. Conventions also are looking for fee paying attendees to hear my talk and slide presentations, and tend to discourage me from publicizing them outside of their formal membership.
-
Recently I’ve been speaking at Science oriented gatherings, Science Fiction Conventions (where I occasionally lead pure science Climate discussions) and public interest groups where my “science oriented” as opposed to “political” message is appreciated. If you are in such a group, send an e-mail and we can work something out. I travel all over the US and outside too, so within our mutual timeframe I’m sure we can get together. A partial list of university venues includes (in no particular order): The University of Alaska, New York University, The University of Connecticut, Stony Brook University (NY), The University of Oklahoma, Louisiana State University, The University of St. Thomas (Houston), The University of San Jose (Costa Rica), The University of Amsterdam and Delft University (Netherlands), and multiple visits to NASA, ESA, and NOAA field centers. In addition, Church, Hadassah, Corporate, Association, school, community, and environmental audiences are all visited. My Bio on the Home Page lists a few more!
-
I also put together regional lists of people interested in my “Colderside©” presentations. A recent NASA appearance in the DC area was actually open to members of the public,< http://ecolloq.gsfc.nasa.gov/archive/2010-Fall/announce.wysmuller.html > and people on my Mid-Atlantic regional list were invited. FAQs 14 & 15 arose from that engagement. FAQ 17 came out of the Heartland ICCC-10 conference held in Washington DC in June of 2015.
Have a burning (or cooling) question??? Send an e-mail to < tom@colderside.com > and it may even end up on this FAQ page if enough people focus on a particular topic.