

The Inconvenient CO2/Sea Level Non-Linkage©
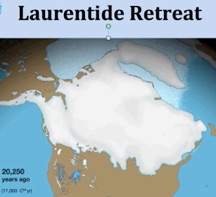
20,250 Years Ago
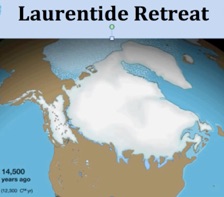
14,500 Years Ago
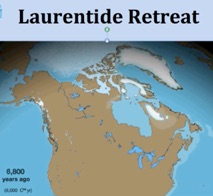
6,800 Years Ago
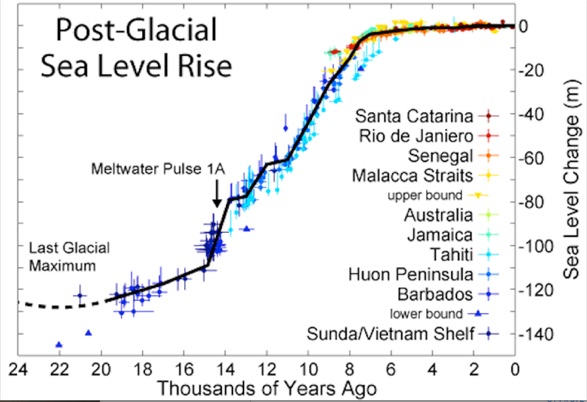
Steady increase 120m Rise Very Minimal rise
Subset here
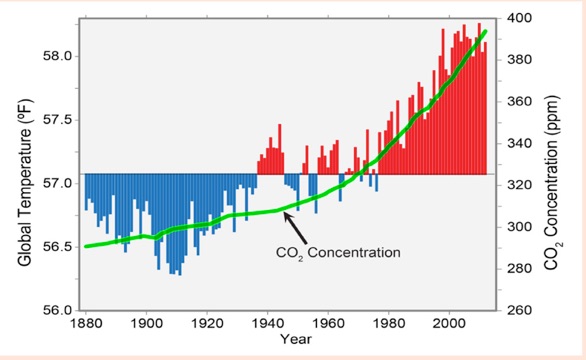
CO2 finally rises, achieving a huge 38% increase in the past 135 years, (since 1880) likely due to industrial and agricultural development.
In tectonically inert areas, where land neither rises nor falls, such as Portland, Maine, and Wismar, Germany, Sea Level continues its methodical steady minimal rise. In the timeframe that CO2 massively increases, there is no sign whatsoever that Sea Level reacts likewise.

With a 38% increase in CO2 you’d expect at least a 1, 5, 12, 25% (take your pick) acceleration of Sea Level. We do have minimal increases, but zero sea level rise acceleration in tectonically inert areas. Zero!!!
If mankind shuts down every coal and gas fired power plant, steel mill, and every auto, plane, train and ship and if we revert to a bare bones subsistence economy, with minimal fire and combustion products, we might be able to reduce CO2 growth from its average annual increase of 1.5ppm over the Keeling Curve era (since 1958) to about 0.5ppm.
When a massive 38% CO2 increase doesn’t even begin to accelerate Sea Level rise, how would we ever attempt to measure any Sea Level fall resulting from an almost impossible to achieve 1ppm reduction. The instrument that could measure that drop has yet to be invented!!!
Conclusion:
There is no measurable linkage between Sea Level and CO2!
(1) http://csdms.colorado.edu/wiki/Movie:Laurentide_Ice_Sheet
(2) Robert A. Rohde per Fleming et al. 1998, Fleming 2000, & Milne et al. 2005 https://commons.wikimedia.org/wiki/File:Post-Glacial_Sea_Level.png
(3) Adapted from Loehle, C. and McCulloch, J.H. 2008. Correction to: A 2000-year global temperature reconstruction based on non-tree ring proxies. Energy & Environment 19: 93-100. http://nipccreport.org/articles/2010/dec/22dec2010a5.html
(4) National Climate Assessment (2014) Melillo, Jerry M., Terese (T.C.) Richmond, and Gary W. Yohe, Eds., 2014: Climate Change Impacts in the United States: The Third National Climate Assessment. U.S. Global Change Research Program, 841 pp. doi:10.7930/J0Z31WJ2. (Page 23)
(5) British Permanent Service for Mean Sea Level http://www.psmsl.org/ & LAMPE, REINHARD; ENDTMANN, ELISABETH; JANKE, WOLFGANG; MEYER, HINRICH; LÜBKE, HARALD; HARFF, JAN; LEMKE†, WOLFRAM, 2005: A new relative sea-level curve for the Wismar Bay, N-German Baltic coast. (Eine neue relative Meeresspiegelkurve für die Wismarbucht, norddeutsche Ostseeküste).- Meyniana, 57:5-35,10 fig., 2 tab., Kiel.
Tom Wysmuller© 25 Oct 2015 – 11:51pm
What follows is my one page summary of the above, English version 1st, followed by the same in French!
No Link Between CO2 & Sea Level! NONE!!!
Tom Wysmuller© 12 Nov 2015 http://www.colderside.com
For the past 2,000 years, Sea Level rise was unchangingly linear, increasing between 1 & 1.5 mm/yr., and CO2 was stable and flat at 280 parts per million (ppm) for the same period, until 1880. The great Ice Sheets from the last Ice Age had already melted.
Additional Sea Level change was slow, mostly due to thermal expansion of oceans and edge ice melt from Greenland and Antarctica. As Earth periodically warmed and cooled, remaining mountain glaciers either grew or added some melt water to the oceans.
In 1880, CO2 finally surges up, achieving a huge 38% increase during the past 135 years, likely due to industrial and agricultural development.
Most seacoasts either rise or fall, due to geological activity. Some do neither, and are “tectonically inert.” Actual Sea Levels, and any changes, are measured from them, such as Portland, Maine, USA, and Wismar, Germany, where Sea Level continues its methodical, steady, minimal, and linear rise. In the timeframe that CO2 massively increases, there is no sign whatsoever that Sea Level reacts likewise.
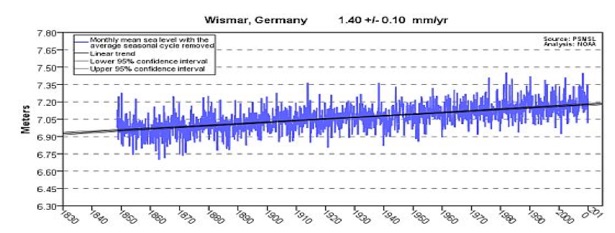
Over 1000 of the world’s Tide Gauges show pure linear trends, along with minimal (mostly thermal expansion and glacial melt) increases. There are none showing any acceleration of Sea Level rise rate in tectonically inert areas.
When a massive 38% CO2 increase doesn’t even begin to accelerate Sea Level rise, how would we ever attempt to measure any Sea Level fall resulting from an almost impossible to achieve 1% CO2 reduction. That Sea-Level drop would be undetectable, and spending $€¥Billions to achieve it, is an indefensible diversion from real problems.
There is no measurable linkage between Sea Level and CO2!
(1) British Permanent Service for Mean Sea Level http://www.psmsl.org/ & LAMPE, REINHARD; ENDTMANN, ELISABETH; JANKE, WOLFGANG; MEYER, HINRICH; LÜBKE, HARALD; HARFF, JAN; LEMKE†, WOLFRAM, 2005: A new relative sea-level curve for the Wismar Bay, N-German Baltic coast. (Eine neue relative Meeresspiegelkurve für die Wismarbucht, norddeutsche Ostseeküste).- Meyniana, 57:5-35,10 fig., 2 tab., Kiel.
Aucun rapport entre le niveau de CO2 et celui des océans
Tom Wysmuller© 12 Nov 2015 http://www.colderside.com
Ces 2000 dernières années, la hausse du niveau des océans a été absolument linéaire, augmentant de 1 à 1,5 mm par année, tandis que le CO2 était stable et fixe à 280 parties par million (ppm) pour la même période, jusqu'en 1880. Les calottes glaciaires de la dernière ère glaciaire avaient déjà fondu.
Le niveau des océans ne changea plus que lentement, en raison surtout de la dilatation thermique des océans et de la fonte des lisières de glace du Groenland et de l'Antarctique. La Terre traverse des périodes de réchauffement et de refroidissement, et selon les cas, les glaciers de montagne grossissent ou ajoutent de l'eau aux océans.
En 1880, le CO2 a finalement commencé à augmenter et, 135 ans plus tard, cette hausse atteint environ 38%, probablement causée par le développement industriel et agricole.
La plupart des littoraux s'élèvent ou bien s'abaissent. Cependant, certains ne font ni l'un ni l'autre et sont “tectoniquement inertes”. Le niveau réel des océans, et les variations qu'il connaît, est mesuré à partir de ces points fixes comme Portland au Maine aux États-Unis, et Wismar, en Allemagne, où le niveau des océans continue sa montée méthodique, régulière, linéaire et minimale. Dans la période où le CO2 a connu une augmentation massive, il n'y a absolument aucune indication que le niveau des océans ait réagit de la même façon.

Plus de mille marégraphes du monde indiquent des tendances linéaires strictes, avec une augmentation minimale (essentiellement dû à l'expansion thermique et à la fonte glaciaire) . Il n'y a aucune indication d'une accélération de la hausse du niveau des océans dans les zones tectoniquement inertes.
Quand une augmentation aussi massive des émissions de CO2 (38%) n'accélère en rien la hausse du niveau des océans, comment pourrions-nous même tenter de mesurer la baisse du niveau des océans qui résulterait d'une réduction de CO2 de 1%, par ailleurs quasi impossible à atteindre. Cette baisse du niveau des océans serait indétectable, et dépenser $ € ¥ milliards, est un détournement indéfendable de nos problèmes vrais!!!
Il n’y a aucun rapport mesurable entre le niveau des océans et celui du CO2!
British Permanent Service for Mean Sea Level http://www.psmsl.org/ & Lampe, Reinhard; Endtmann, Elisabeth; Janke, Wolfgang; Meyer, Hinrich; Lübke, Harald; Jan, Lemke†, Wolfram, 2005: A new relative sea level curve for the Wismar Bay, N-German Baltic coast. (Eine neue relative Meeresspiegelkurve für die Wismarbucht, norddeutsche Ostseeküste). – Meyniana, 57: 5-35,10 fig., 2 tab., Kiel.
(5)
Starting 7,000 years ago, Sea Level rise leveled off and only slowly rose, mostly due to thermal expansion of oceans and edge ice melt from Greenland and Antarctica. As Earth warmed, remaining mountain glaciers also added their melt water to the oceans.
When largely Northern Hemisphere land ice melted, its concentrated weight was equally distributed among all the oceans, causing uplift on formerly ice-covered land. Added water weight, deepened ocean basins, and land subsided adjacent to those basins. Actual Sea Level is measured from tectonically inert areas, neither rising nor falling.
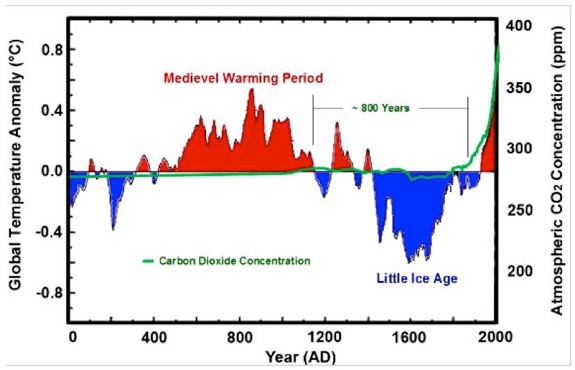
The latest 7,000 year minimal Sea Level rise was matched by CO2 readings that varied even less. A steady CO2 280 ppm continued for the same 7,000 years, apparently not affected by, or influencing some wide temperature swings. Graphics that follow cover the past 2,000 years [Temp. & CO2] and a recent 135-year subset of the same. (3)
135-year Temperature & CO2 Subset of the past 2000 years (4)
During the past 20,000 years, Sea Level rose as the great Ice Sheets melted. Exiting the last Ice Age, the massive (miles deep) North American Laurentide Ice Sheet disgorged megatons of water, flooding the continental shelves.
- Screen shots courtesy of csdms.colorado.edu (1)
The most rapid rise was between 14,500 & 7,500 years ago. (2)