“The Colder Side of Global Warming©”
Frequently Asked Questions [FAQ] Page
[ Toucan Equations begin with FAQ # 11 and have received the January 15th 2011 update ]
As more questions are added, this page eventually will be indexed, but as there are only a few entries now, just scroll through the list and see the most frequent requests.
1. In the late Michael Crichton’s book “State of Fear” is he right in claiming that Global Warming is just the effect of our measuring temperature in urban areas, and as they expand over time, their “heat island” effect naturally results in historical temperature increases?
Both Global Warming and the acceleration of Global Warming due to human activity are real, the latest rise beginning about 18,000 years ago, and the acceleration within the past 200 years. The misinterpretation in “State of Fear” becomes obvious when you see how temperature rise has been measured in all the world’s oceans as shown in the slides of my “Colderside©” presentation, and the oceans are not plagued by urban heat islands.
Now I’m by no means entirely “down” on Crichton’s book. On the contrary:
1. The epilog on Eugenics should be required reading by anyone with an interest in good science. Michael Crichton generously made it available on the internet at: http://www.michaelcrichton.net/essay-stateoffear-whypoliticizedscienceisdangerous.html , and I hope his website managers continue to do so.
2. With some unfortunate irony, he missed the connection between the end of Lysenko’s reign and the brilliant Russian VOSTOK research that was spurred on by the East trying to catch up to Western Mendelian genetics as it was covered in the “Colderside©” presentation.
2a. “Explain please why sea levels won’t be rising” [Also see FAQs 11 - 15 below]
As the Earth and its oceans continue warming, we’ll likely get about an additional half inch or so of sea level rise due to ocean thermal expansion, and at most another 3 inches from edge ablation of Greenland's and Antarctica's glaciers but no more! [See FAQs 11 - 15 below] The North Polar Cap is melting, and with extreme rapidity, as you can see in some of the videoclips shown in the formal presentation. But for the most part, it is floating and has already displaced the water within which it floats. This is Archimedes’ Principle, and he figured it out over 2,000 years ago – thus there’s no sea level rise from the Arctic polar ice melt.
2b. “But what about Greenland and Antarctica melting?"
Now the ice on Greenland and Antarctica isn’t floating, and if melted would certainly contribute to sea level rising, but the Russian Vostok and European EPICA ice core history covers many periods, each time when it was even warmer than now, and when the north polar sea opened up (as it is doing now per Ewing’s and Donn’s prescient insight), at each of those times, the world plunged into an “Ocean Effect” fueled albedo change and subsequent Ice Age. Those Ice Core records couldn’t exit if Antarctica and Greenland had ever melted!!!, and as our acceleration of Global Warming counter intuitively short circuits our present warming cycle, it will get colder sooner rather than later, with no appreciable additional Greenland/Antarctic ice melt.
3. “What are other (near term) implications from your theory?"
First, although I endorse the theory, it is Ewing’s and Donn’s theory, and it is their insight that deserves the credit.
Second, as more Arctic Ocean becomes exposed for longer times before being sealed by seasonal pack ice formation, snows will fall earlier each year, in larger amounts, and linger on the ground longer into the spring. Albedo reflectivity from snow is negligible during the dark arctic winter, but both in early fall, and as spring arrives, the snow in higher latitudes remains on the ground longer, and reflectivity increases. Thus the central US and the East Coast will experience cooler springs and the transition into summer temperatures, although somewhat later, will be relatively rapid. The US West Coast will have warmer springs and summers, as will Western Europe. Warmer weather may may not make it through October’s end almost everywhere, and winters will be sharply colder. The massive pack-ice loss of 2007 followed by a similar loss in 2010 set up ocean effect snows on the Arctic Shores that increased reflectivity. Colder Northern Hemisphere winters with sharp temperature contrasts are an inevitable result. Europe's 2010-2011 winter was a consequence and in the US we saw 49 states with some (high albedo) snow on the ground during January 2011.
4. “Are “Mainstream Scientists” and “Global Warming disbelievers” both wrong? How do you reconcile your presentation to the current media’s portrayal of Global Warming? "
On the contrary, to a very large extent, they’re both right! And neither seems to give much quarter to the other!
The majority of “Mainstream Scientists” as exemplified by the IPCC, very correctly and accurately have looked back upon the past 200 years and ascribed some of the observed Global Warming acceleration to human factors. The few who blame all of the warming on people are simply wrong. The “disbelievers” point to Ice Core data clearly showing a cyclical pattern, and declare that within the range of the cycle, everything’s “normal” and we shouldn’t be too surprised if solar variation, precession of the equinoxes, Milankovitch Cycles, etc., cause climate variation, and that human activity plays a small part, if any.
There are many examples of well meant ‘explanations.’ In the short time available in the 2+ hour presentation, I mentioned Michael Crichton’s “Urban Heat Island” disclaimer (see FAQ #1 above), followed by the ocean temperature and NYC Watershed slides that pull the rug out from under most (but not all) of it. The “disbelievers” still don’t have a cogent explanation for the 140,000 year ± cyclical phenomenon as accurately portrayed by Ewing and Donn – independent of human activity over the eons, but based upon glaciations fed by an open Arctic, whose re-opening has been clearly and rapidly accelerated by our species this time around.
An analogy would be that of a man walking backwards, clearly seeing with 20/20 hindsight the real impact of Human carbon mismanagement on recent climate, while obliviously moving towards, and about to fall into a Ewing/Donn snowbank..
5. “How about “Carbon Management.” Is that a solution we can live and work with?
Yes and No, and it depends upon which problem(s) you are addressing. The reasons most offered that purport to curtail or eliminate climate change or Global Warming are the wrong ones, and “No” is the answer here. No amount of “Carbon Management” and associated “Green” efforts will stop the Arctic multi-year ice from melting within the next 20 or so years. It was already too late when the industrial revolution began!
If tomorrow, every factory would shut down, every automobile and plane would cease operating, etc., etc., the Arctic Polar Cap would still continue melting, period!!! The associated global albedo (reflectivity) and climate changes are already beginning to happen! And NO cessation of human carbon oriented activity will have the desired impact. There are other ways to address that problem, and the Norway/Bear Island/Svalbard solution discussed in detail in the “Colderside©” presentation actually can add controls to the problem. In addition, the beneficial solution to the world’s growing fresh water problem can be addressed by the same mechanism and is likely the most cost effective response with available technology.
The “Yes” part of the answer on paying attention to “Green” issues is still absolutely valid, for energy usage, Hubbert Curve, conservation, environmental, and quality of life issues that include air and ocean pollution from real pollutants, poisons (CO2 is not among them), and carcinogens. For these reasons, green management, recycling, conservation, etc., makes unequivocal sense, and hope you behave accordingly! But inclusion of “Global Warming” in the mix (as the presentation explains) may just make it easier for the general public to “buy into” these suggestions, but unfortunately it will have incredibly little impact on the climate.
6. You mentioned moisture transition was analogous to how Dentists work. You’ve got to be kidding???
Here’s how Dentistry figured in the discussion:
Recall that temperature of water (ice, liquid, and vapor) is a direct function of molecular motion, and as we transition from one cooler state to another warmer one, molecular motion must increase.
On a stove, we can melt ice and then boil off the subsequent water to create water vapor, adding heat energy throughout the process. By the time we create the water vapor, these H2O molecules are really moving, having absorbed the energy that got them to that state.
Ocean temperature also factors into the likelihood that a molecule near the surface will convert into water vapor, but wind is most often the deciding factor that provides the final “kick’ of kinetic energy to create water vapor. The ocean “chop” in the slide of the Divi-Divi tree illustrated the effect of the Trade Winds – the constant 18 or so mph that constantly liberates water vapor from the warmest oceans in the world.
Hurricanes liberate MUCH more water vapor, by supplying incredible amounts of kinetic energy to the roiling oceans underneath the storms, with violent wind force that batters and tears at the water, liberating prodigious amounts of water vapor in the process. It is this water vapor, loaded with latent energy, that fuels the energy needs of a hurricane.
Here’s where the Science of Dentistry figures in: Most people believe it is heat (from the sun, a stove, fire, etc.) that supplies the energy to create water vapor. This is abetted by the term “Latent Heat of Condensation” to describe the release of energy when water droplets condense out of cooled water vapor. If Meteorologists would have had the sense to call it “Latent Energy of Condensation” some of the confusion might be avoided, for it is usually wind that originally supplied the final energy “kick” into water vapor.
When Dentists want to dry out a just rinsed out tooth cavity, they don’t apply a heat lamp. Instead they direct a stream of air (i.e. wind) over the area to immediately dry out the tooth. The air stream adds kinetic energy to the water present and immediately kicks the water into a higher energy state – water vapor – that instantly dries out the tooth surface. The area now feels a bit cold, because in becoming water vapor, lots of energy has been absorbed by the now energized water vapor molecules, and some of that came from the tooth (and surrounding gum), extracted by the transitioning water vapor.
This was included in the description of the effect that wind has in liberating water vapor, first from the Great Lakes and a later ice-free Arctic Polar Sea and subsequent condensation into snow. Here again, it is the equivalent of a Dentist’s “wind” that serves to convert the liquid water into vapor.
7. Why haven’t I heard about Ewing and Donn before?
Now you have! Decent biographical information is found in many places on the internet. I believe that the Navy still gives its “Ewing Medal” for achievements in oceanographic excellence. You can see slides and hear detailed information in the presentation about some of the “discrediting” that later was stunningly shown to be incorrect.
8. Are you ever going to post your presentation on the internet?
This presents a problem that may be solved in the next few years., as recordings have been made by some Universities and Government institutions. When I get comfortable with one of the recordings, I'll seek the ability to either link to them or post them here. Some of my slides and videoclips, like the Jupiter clips, are incredibly dense and consist of thousands of pictures which you view in a few seconds. Download times at appropriate resolution would just be too long. If I get my editing act together, I may make a montage of a number of prior recordings and make a DVD available through the mail, and that may happen next year, but not next month.
However, the Town of Hampton New Hampshire’s Energy Committee has posted a 1.5 hour video recording of a “Conversation” with me on September 3, 2009. Not addressed in it are the recent record setting October and December climate graphics of albedo driven cold in the Midwest and rest of the world. Sea-Level changes are mentioned but without the equations and detail in these FAQ pages. Link to it here:
< http://hamptonchannel22.pegcentral.com/player.php?video=2da5a0216f51be2b0f16ad0f39573a52 >
9. How about audio clips?
A 2004 radio interview is archived on the internet. You can access the October 5, 2004 WBAI Radio (NYC) program here (MP3, WMA). The hour is called Eco-Logic and is hosted by Ken Gale, an accomplished environmental interviewer. Recent Climatological events have actually accelerated the trends discussed. The audio clip begins with the last four minutes of the prior show, and also contains a (in 2004, new) neat song by the gifted chanteuse Sharon Abreau that echoes environmentalist’s concerns. The interview itself focuses purely on the science involved. The most recent audio was on January 11th, 2011 at 8PM, and can either be streamed live or downloaded from their archive at WBAI Radio (NYC) .
10. Can you briefly summarize the content of your presentation?
Sometimes third parties can actually do it better! The American Institute for Aeronautics and Astronautics’ Houston Chapter put out a special 50th anniversary of NASA issue in late 2008, and their technically astute Assistant Editor, Sean Keefe, put together a summary of my visit to NASA’s JSC. A PDF of the issue can be downloaded < http://www.aiaa-houston.org/Newsletter/october2008.pdf > and in addition to the Colderside© summary on pages 5 & 6, the issue has other fascinating articles, including an interview with Norm Chaffee, the NASA scientist who helped orchestrate the “barbecue process” that saved Apollo 13.
In the meantime, I try to schedule presentations on a regional basis, so as to keep travel and other costs reasonable. E-mail me at < tom@colderside.com > to see if your university, group, company, organization, etc., can be accommodated soon, and please be sure to read the MFN stipulations!
“The Colder Side of Global Warming©”
FAQs on Sea-Level and “Leap Second” Pages
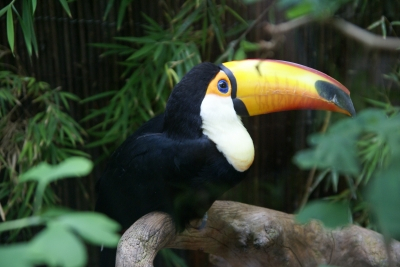
11. Can you briefly discuss the “Toucan Sea-Level equations©” described in your presentation?
The “Toucan Sea-Level equations©” refer to the shape of two inequalities zeroing in on the upper and lower Sea-Level limits expected in the near future. When viewed together, they roughly take the shape of a Toucan’s beak, and as more data becomes available, that “beak” will begin to slightly change shape and close.
The equations are in an inequality >, <, (Greater Than, Lesser Than) form, and like the bird’s beak, have thickness to accommodate the variation found in the data acquired by satellite input upon which they are based. The data set used does not have modifications, so that neither seasonal adjustment nor inverse barometric adjustments are applied. Over the 16 year period that the TOPEX and Jason-1 satellites have been acquiring Sea-Level data, variation in any given year has stayed within a 20 mm band and the equation’s intercepts have that adjustment added in, on the upper and lower bounds, so that there is virtually NO CHANCE that Sea-Levels will rise above, or fall below the limits. In the event that external earth based natural factors intervene, the lead times for making changes will be very substantial in any case.
If you want to see some neat graphics and use different data sets, go to the University of Colorado web site http://sealevel.colorado.edu/results.php which has seasonally-(un)adjusted, and inverse-barometer-(un)corrected TOPEX/Jason data.
12. What are the “Toucan Sea-Level equations©” exactly?
“ΔSL” is the Sea-Level difference from 1993 measured in millimeters, “Y” is the year, and the “to” appearing in the last term is the last two digit’s variation range above or below the “best fit” generated by the Polynomial Regression method. The range between the two terminal digits of the Upper level’s 41 and 61 and Lower level’s 72 and 52 represents the “thickness” of the Toucan’s beak
These equations will be updated annually - the next update will be on this page by 15 January 2012
I've had feedback that the inequality format was not easily understood by webpage visitors, nor was the range notation which I've replaced with the non mathematical word "to" in each equation. The inequality sign "<" (read: "Less than") just means that Sea Level will be lower that the change since 1993. Similarly ">" (read Greater than) means Sea Level change will be in excess of the change since 1993 .
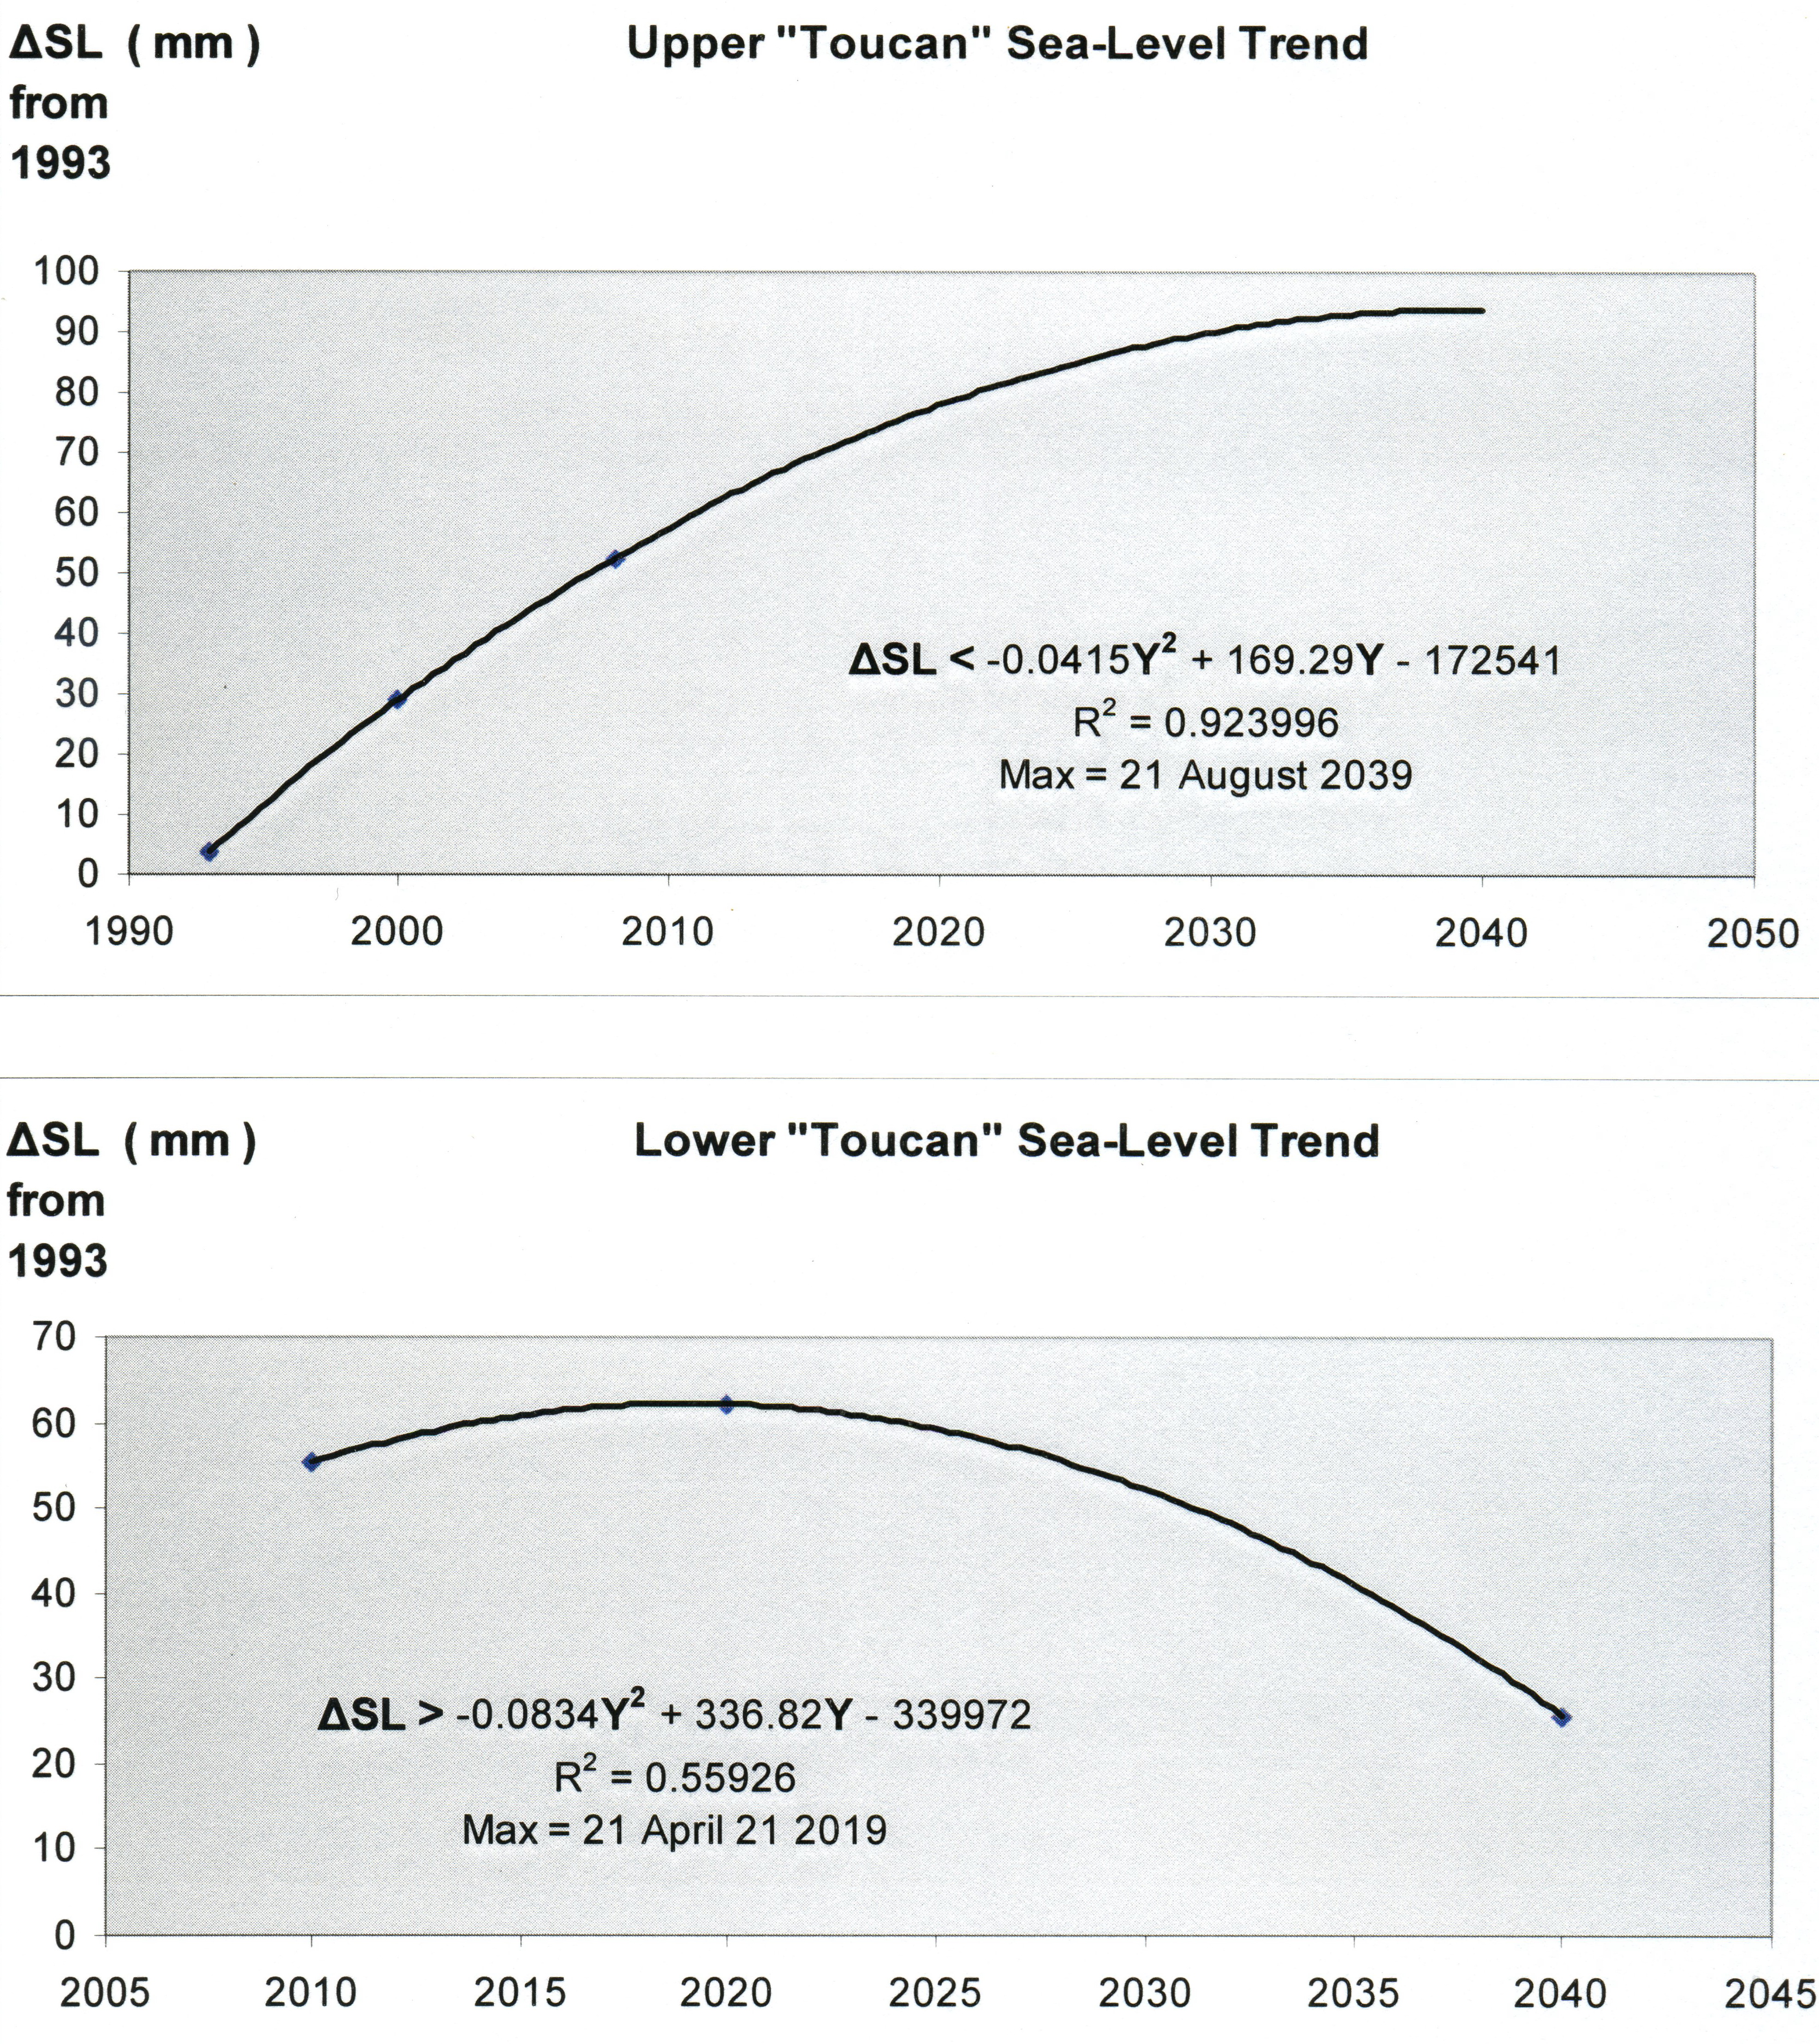
Upper “Toucan Sea-Level equation©”:
ΔSL <-0.0415Y2
+ 169.29Y -
172541 to 61
R2 = 0.923996
Lower “Toucan Sea-Level equation©”:
ΔSL >
-0.0834Y2
+ 336.82Y - 339972 to 52
R2 = 0.55926
The Upper equation is derived from the combined TOPEX and Jason-1 satellite data after 1993 and through midyear 2009. The Lower equation is based upon just the Jason-1 data starting in 2002.
These original equations will stay on this page and serve as a check on their predictive ability. Each year's addition will follow below. If future iterations end up lying within the original "Boundary Equations," (and Toucan's beak as well), they have served their purpose well, and the direction of Sea-Level will be unmistakable.
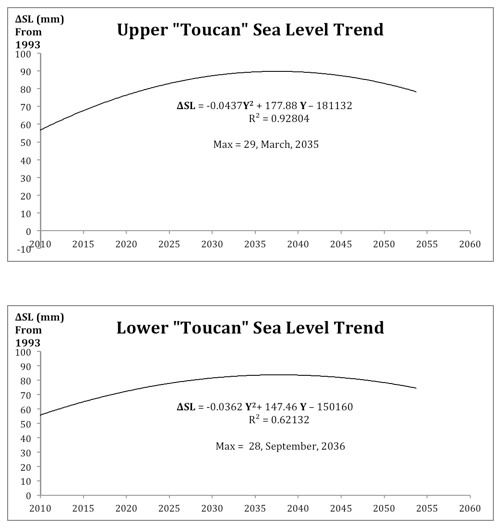
January 2011 Update
The Toucan's bill has closed this year (it may open again somewhat in the future) and both trends converge with a maximum now in the mid 2030s, well within the Boundary range of the original Upper and Lower “Toucan Sea-Level equation©.” So I've added a more representative Toucan Bird (Bill closed) for 2011.
Upper 2011 “Toucan Sea-Level equation©”: ΔSL = -0.0437Y2 + 177.88Y - 181132
R2 = 0.92804
Lower 2011 “Toucan Sea-Level equation©”: ΔSL = -0.0362Y2 + 147.46Y - 150160
R2 = 0.62132
Substitute a year in the near future for "Y" and ΔSL will show the change in world Sea-Level since 1993 in milimeters. (1 inch = 25.4 mm). If the satellite data continues on its present trend, less than 3 inches of Sea-Level rise remain before ocean levels begin dropping in the mid 2030s!!!
13. Why did you use “Polynomial Regression” instead of the Linear fit everyone else seems to use? Isn’t it invalid for predicting outside of the bounds of the data set?
In general your point is correct and certainly for Polynomial Regression of 3rd, 4th, 5th, (cubic, quartic, quintic,) etc., etc., and higher powers. For those situations, Polynomial Regression is useful as an interpolative routine to make mathematically accurate predictions within (and only within) the data range of the regression. Polynomial Regression will almost always have a better "fit" to a given range of data because of the equation's ability to "snake" through a data set and thus correlate better than a straight line or lower order polynomial. In the "Toucan" equations, the direction of the "snake" shows a near term rise followed by a declining trend.
The exception to the interpolation restriction is the first and second power regression, and here we use quadratic or 2nd degree equations, as in both cases (TOPEX and Jason-1), the “goodness of fit” to the data is improved over the 1st degree or linear approximation as described above. The improved correlation of the second degree polynomial curve over a linear approximation is crucial for trend purposes, and accuracy in, and direction of, trend line was the objective. The equations are overly sensitive to small changes in their coefficients because of the large X values associated with using years; the original trend data analysis used X values under 10 and data points literally with pinpoint accuracy.
Most important is relating the mathematical data and external events influencing it, as discussed in the next FAQ.
14. What is the reason for splitting the “Toucan Sea-Level equations©” between the combined TOPEX and Jason-1, and then using Jason-1 only for the Lower bound?
Here’s where knowledge of external events helps in choice of approach. Professor Richard S. Lindzen, the Alfred P. Sloan Professor of Atmospheric Sciences at MIT, regarding this approach says “I have to admit that I'm no fan of trend analysis -- especially when there is such sensitivity to starting and ending points” and he is absolutely correct in understanding the underlying mathematics involved here. The “end point” phenomena here that had massive and recent influence was the million square kilometer chunk of Arctic Ocean exposed in 2007, which was responsible for the record Northern Hemisphere snow cover extent of 2008. It was my specific intention to use that “end point” influence to assure that the “Toucan Sea-Level equations©” were valid maxima and minima.
This is a direct consequence of the more open Arctic providing more moisture for increased land based snow accumulation, and the accumulation remaining on Greenland and surrounding land areas. Thus the Jason-1 data, unduly influenced by current events (couldn’t resist), forms the lower “boundary” of the Sea Level limits, and as the open “chunk” has somewhat ( by 200,000 sq. km) repaired itself (largely due to the abysmally record cold of the albedo change it caused), the chances of the lower limit being pierced are quite slim. A similar situation at the end of summer in 2010 will likely have the same consequence.
Similarly, retaining the TOPEX combined data for the upper limit has the same effect, as the older data served as an anchor and "drove" the curve upwards. As more and more Arctic Ocean gets exposed (it opened again in 2010), the chances of the upper boundary being pierced is again almost negligible, and the combination of both thus meets the purpose of boundary equations, serving as dependable limits. Even the upper limit (as of 2010) has Sea-Level declining in the mid 2030s, and annual adjustments to the "Toucan's beak" will show whether that estimate holds.
15. I constantly hear about massive coastal flooding and that whole seacoasts will be inundated by rising oceans. The “Toucan Sea-Level equations©” imply that it won’t happen.
There’s more involved here than just the satellite data, and I’ll address another aspect in the next “Leap Second” FAQ. Realize that in the 17 year period of TOPEX and Jason-1, the oceans have risen less than 50 millimeters – that is under two inches! Two of the components, increased land-based snow accumulation, and decreasing thermal expansion (as albedo increase begins to cool parts of the ocean), are already helping to ameliorate the rise. Recent warming of both the Arctic and Antarctic oceans has caused pack ice to shrink and expose shorelines to more open water. Thus "Ocean Effect" snows can deposit more snow on interior Greenland and Antarctica, and that is exactly what's being observed. Even though the edges of Greenland and Antarctica are losing ice at markedly accelerated rates, their interiors are outpacing that loss and increasing their rate of accreting snow and ice. When that gain overtakes the edge melt, this particular component of sea level rise turns negative. As some of these effects counterbalance others, expect them to vary each year (and they do!). Both Polynomial Equations are better at picking up these trends and their directions than their linear counterparts, and that is why I use them!
Now there are parts of the world where coastal areas are sinking on their own. Venice, Italy, comes to mind, and the US Texas Seacoast too, as the water requirements of their large cities work to deplete the Ogallala Aquifer, leading to some land subsidence and seawater intrusion into the underground water supply. After the mid 2030s (the current projection for Sea-Level peak) subsiding Gulf of Mexico Sea Levels will begin trying to play "Catch-up" with the sinking coastal land. In Texas, some first-rate minds are focused on the problem, including Professor John W. Nielsen-Gammon, the Texas State Climatologist who has been keeping the IPCC honest (as much as he can) with his careful error checking ability intact.
By January 15th of EACH YEAR, I’ll be adjusting both Upper and Lower equations to take new data into account. My expectation [ as of 2009 ] is that the Toucan’s lower bill will rise a bit in the next few years and the upper bill will decline, but somewhat less. [ That's exactly what happened in 2010!!! ] Stay tuned, attend my frequent presentations, and check this FAQ page!
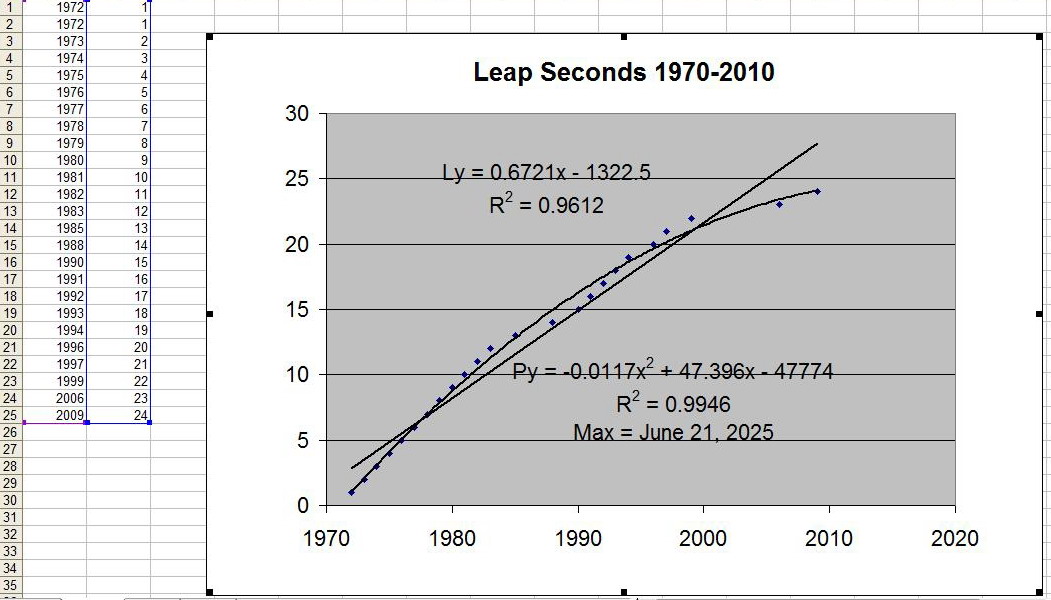
16. You mentioned a decline of trend in additional “Leap Seconds” as being part of the evidence for Sea-Level rise deceleration and eventual decrease.
Leap Seconds are added to our year to accommodate the gradual slowing of the Earth’s rotation due to many factors such as energy loss through oceanic and atmospheric tidal friction, lunar gravitational “drag” on the planet, surface mass redistribution "rebounding" from glacial weight, and interior magma and core friction, to name just a few. But a Polynomial Curve fit that is more highly correlated than a linear fit, shows the rate of leap second addition to be decreasing.
Now, as mentioned above, many factors are involved here, and the trend actually began decreasing in the late 1980s, but resumed in the early 1990s (a good case for Mt. Pinatubo’s influence can be made here), only to decline again in recent years. The increased snow deposition on land surrounding the Earth’s axis of rotation is the major suspect. As an open Arctic Ocean adds more available moisture to fall as early snow in northern latitudes, the effect is that of adding momentum to the planet’s rotation, much like an Ice Skater pulling in arms close to the rotational axis of the body to increase spinning speed. Now the snowmelt of spring returns the deposited snowmass to the oceans or atmosphere, but earlier snowfall and later/slower melting, both serve to gently add that momentum to the Earth’s spin. So the slowing (and need to add “Leap Seconds”) diminishes, and eventually will be replaced by subtracting them, as more and more Arctic ocean opens up and massive snow accumulation coupled with albedo change and colder temperatures begin to accelerate the Earth's rotation.
I’ll update the above chart too as “Leap Seconds” are added. With (lots of) luck, I’ll be alive in years after 2025 to witness the first “Leap Second” subtraction!
17. Couldn’t El-Niño be responsible for augmenting Earth’s rotational speed? The warming equatorial ocean’s thermal expansion (or contraction in the case of La-Niña) would have affected the planet’s momentum, right?
Not quite! Thermal expansions and contractions are (very) gradual processes taking months to change. By increasing or decreasing the sea-level through temperature change, the oceans have much time to adjust through current flow, and that is exactly what happens, as the water will seek its own global level. Evidence of this self-adjusting is that we see no “Niño/ Niña” evidence visible in the Jason/Topex sea-level data, which extends back to 1993. You would expect a signal to show up in the form of a wave flowing through the data set, as there have been nine such oscillations in the period, but only one trend change, synchronous to the recent increased land based Arctic and Antarctic snow deposition. The snow/ice remaining on land actually shifts equally distributed water mass to the Earth's axis of rotation.
18. Milankovitch Cycles have been credited as being predictors of climate. Any validity to the Ewing-Donn “Open Arctic” model being predicted by Milankovitch?
Milankovitch Cycles include a combination of Precession (26K years), Eccentricity (95K years, and Obliquity (42K years). The theory holds that when in phase, Glacial and Interglacial periods occur. However the Vostok and EPICA Ice core records may well understate the length of these intervals, yet even if exact, Milankovitch Cycles have predicted nine of the last four well defined cooling and warm periods. Coincidence is not necessarily causation, and when 5 “predicted” periods just aren’t there, Milankovitch falls a bit short. Ewing-Donn, on the other hand, describe a precise physical mechanism [ Open Arctic, Sea level drop, Closed Arctic, Sea Level rise, Open Arctic (ad infinitum) ] that clearly explains all of the intervals. Now Sun Spot linked solar variability (not contained in Milankovitch) is also evident in the Beryllium 9/10 ratios noted in Ice Cores covering the Maunder minimum, but cover much shorter time periods. The Sun Spot signal, though weak, is evident in troposphere temperature measurements, but does not show up in JASON/TOPEX Sea Level data.
19. Why don’t you post your speaking engagements on your website?
Most of my speaking engagements are not usually open to the general public. They may be clients who want a talk specifically structured to their group or audience, colleges or universities and schools that do not want the general public to access their buildings, or just groups that have an educational desire for themselves. Security issues are also of concern at government facilities where I have given talks. Conventions also are looking for fee paying attendees to hear my talk and slide presentations, and tend to discourage me from publicizing them outside of their formal membership.
Recently I’ve been speaking at Science oriented gatherings, Science Fiction Conventions (where I occasionally lead Climate discussions) and public interest groups where my “science oriented” as opposed to “political” message is appreciated. If you are in such a group, send an e-mail and we can work something out. I travel all over the US and outside too, so within our mutual timeframe I’m sure we can get together.
I also put together regional lists of people interested in my “Colderside©” presentations. A recent NASA appearance in the DC area was actually open to members of the public,< http://ecolloq.gsfc.nasa.gov/archive/2010-Fall/announce.wysmuller.html > and people on my Mid-Atlantic regional list were invited. FAQs 17 & 18 arose from that engagement
Have a burning (or cooling) question??? Send an e-mail to < tom@colderside.com > and it may even end up on this FAQ page if enough people focus on a particular topic.